Autoregressive Model
Autoregressive (AR) models represent random processes in which each observation is a linear function of some of its previous values, plus noise. I present the main ideas behind AR models, including when they are stationary and how to fit them with the Yule–Walker equations.
In statistics and econometrics, an autoregressive (AR) model is a statistical model of a particular type of random process, one in which a time-dependent scalar random variable is a linear function of some of its previous values, plus a random term. Formally, the model is:
This is called an autoregressive model of order and is denoted AR. are the model’s parameters, is a constant bias, and is white noise.
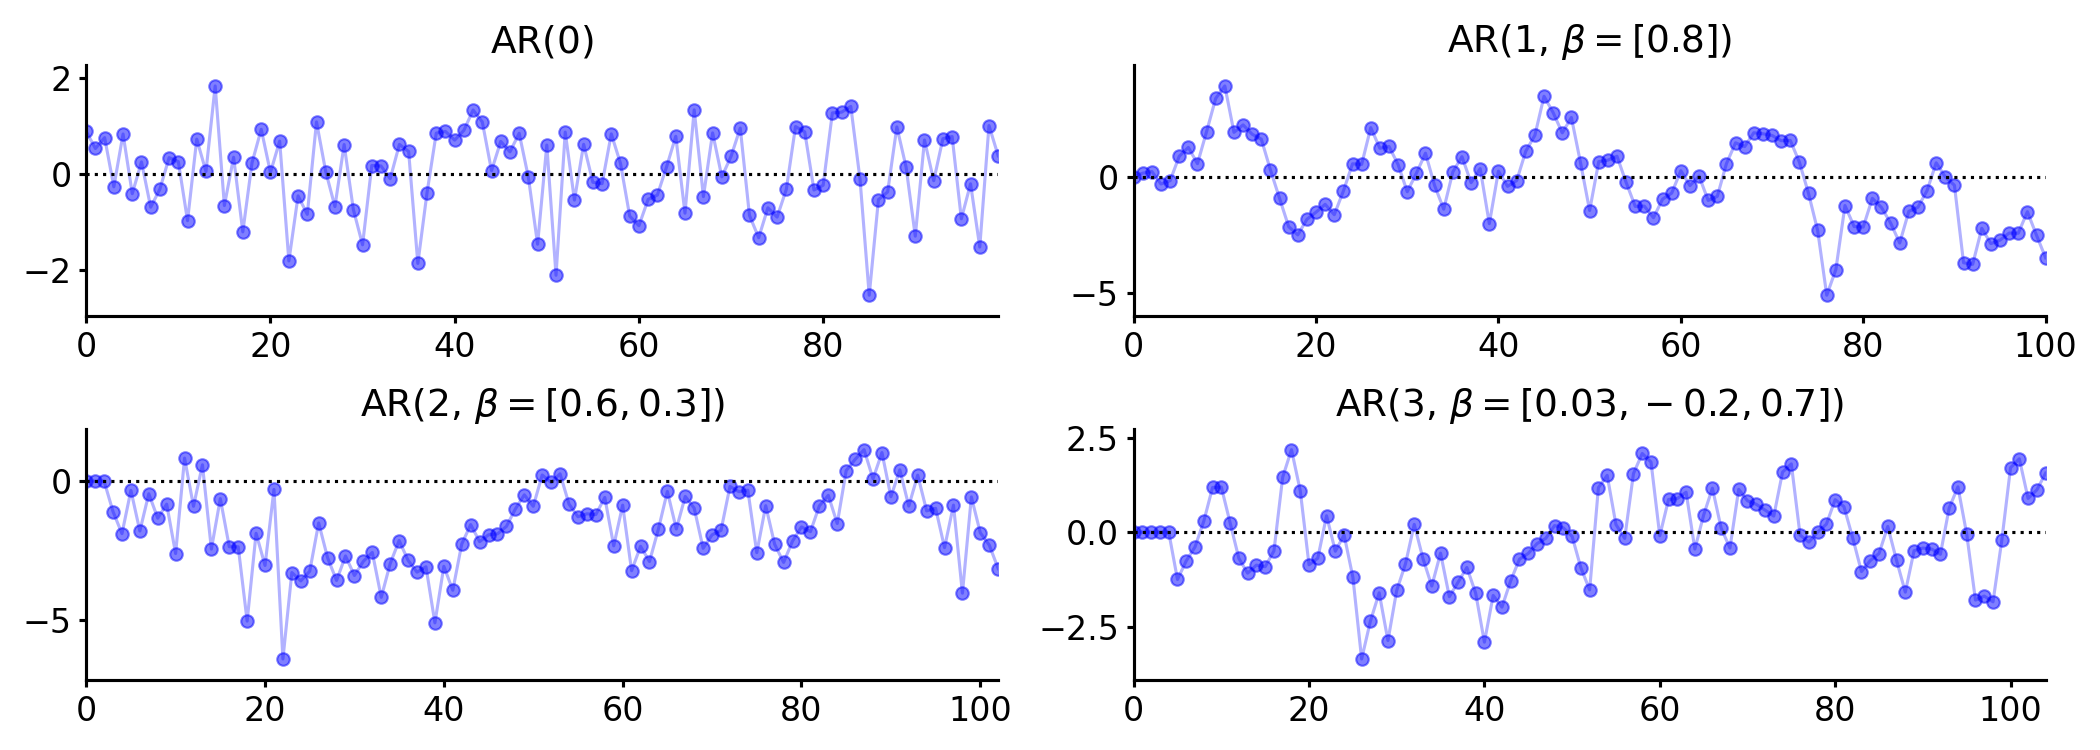
An AR process is simply random noise, with no dependence between time points. As increases, the induced AR model becomes more complex, as it accounts for more previous terms in the estimation of the current term. See Figure for synthetic data from AR processes of increasing order.
For what it’s worth, according to (Greene, 2003), “The received empirical literature is overwhelmingly dominated by the AR model, which is partly a matter of convenience. Processes more involved than this model are usually extremely difficult to analyze…” He goes on to write, “The first-order autoregression has withstood the test of time and experimentation as a reasonable model for underlying processes that probably, in truth, are impenetrably complex. AR works as a first pass.”
Stationarity
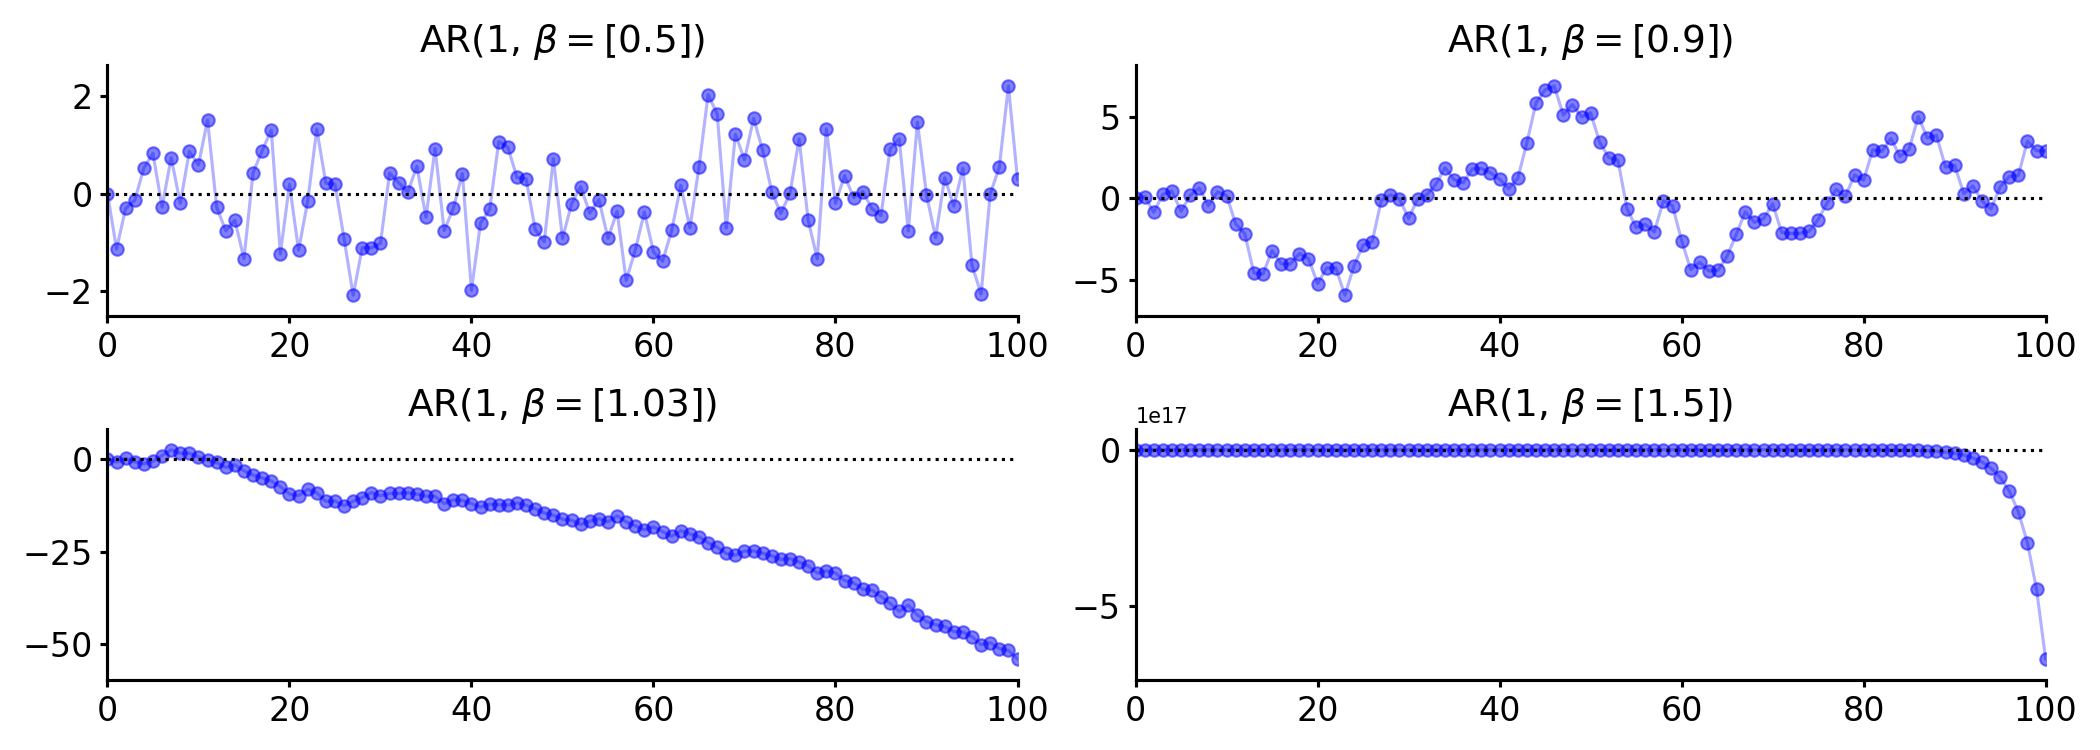
An important property of an AR process is that it has finite variance if the sum of the absolute values of its coefficients is within the unit circle, i.e.
Intuitively, this means that provided Equation holds, then the value of the AR process doesn’t rapidly diverge (Figure ).
However, Equation is actually just the consequence of a more important property of AR processes and time-series more generally: stationarity. As I understand it, stationarity is a statement about the sequence of moments of a distribution. In particular, consider the definition of weak stationarity, sometimes called covariance stationarity:
Weak stationarity: The random process is weakly stationary if is finite and independent of , is finite for all , and is finite and only depends on .
Covariance stationarity is important here because if we assume that both and are weakly stationary, then we can derive the first and second moments for . First, let’s assume the following about the sequence of error terms :
It’s clear from Equation that is a covariance stationary random process. We can use these assumptions to derive the conditions required for finite mean and finite variance for the AR process . The mean is
and variance is,
So both the mean and variance of are fixed properties of the AR process—functions of , , and . For our assumption of weak stationarity to hold for , it must be the case that Equation holds, that .
Inference via the Yule–Walker equations
AR processes can be fit in a variety of ways, such as with maximum likelihood estimation, least squares regression (OLS), and method of moments (Yule–Walker equations). I’ll present the Yule–Walker equations because they are simple to derive and program and, in my mind, nicely capture the intuition for AR processes. In contrast, OLS estimation is not causal and is biased. See A1 for a discussion of this.
Much like how the Baum–Welch algorithm is an instance of expectation–maximization applied to hidden Markov models, the Yule–Walker equations are an instance of method of moments applied to AR models. Thus, the goal of this approach is to estimate moments (here, autocorrelations) of the AR process.
The Yule–Walker equations are not particularly hard to understand, but deriving them is tedious. To make the material easier to grok, let’s break the discussion into three parts: some preliminaries, including helpful notation; a discussion of the big idea; and then detailed derivations.
Preliminaries
First, let’s assume an AR model that is covariance stationary. Second, let’s ignore the bias term . De-meaning is easy to do, and this will clean up the notation. Now consider the covariance matrix with the following notation. In general, let be defined as
So the matrix can be written as:
The key things to note are that by definition and that for all . This simply because of the symmetry of covariance,
Finally, consider a correlation matrix where each element is defined as simply
Step in Equation is from Equation , i.e. each has the same variance or
To be explicit, this correlation matrix is just normalized by :
With these preliminaries out of the way, let’s discuss the big idea of this approach.
Big idea
The basic idea of the Yule–Walker equations is to construct a system of linear equations,
representing the relationships specified by the AR model. The matrix is the matrix in Equation above, and the vector the first column (or row) of but shifted by one, i.e.,
The unknowns in this equation are . Intuitively, Equation captures the assumed autocorrelations encoded in the AR model, and solving for in this way gives us parameter estimates that capture these modeling assumptions.
Now here’s something fun. Since is a symmetric Toeplitz matrix, we actually only need to estimate a single column (or row) of in order to construct the whole thing. Thus, we just need to estimate and from data. We can then construct with the appropriate tiling and then solve the system of linear equations for .
Derivations
Now let’s derive and each component of . These derivations, and the notation and , are from Gidon Eshel’s lectures notes. Consider the following AR process,
Estimating . Let’s multiply both sides by and then take the expectation of both sides. Since our noise is zero-mean and since are non-random, we have
The important thing to note is that the left-hand-side of Equation is an un-normalized cross-covariance term. If we normalize by , we get cross-covariance terms ; and if we divide these by , we get autocorrelation terms . Let’s do that:
An attentive reader may notice: the last line of Equation is the first line (implicit) in the matrix equation in Equation . Indeed, we’re going to build Equation “line by line”, so to speak.
Estimating . Let’s do the same process as above, but only after multiplying Equation by rather than by . As you might imagine, this will produce :
This is the second line in the matrix equation in Equation .
Estimating . We can see how this generalizes. To be thorough, let’s compute for any row :
Summary
Hopefully, how we mechanically construct the Yule–Walker equations is clear. We simply compute using Equation for all . We use the last elements to construct the -vector , and we use the first elements to construct the first column in . We then appropriately tile this column to construct a symmetric Toeplitz matrix. We can plug these quantities into Equation to solve for .
Implementing the Yule–Walker equations in code is fairly straightforward. See the fit function in the Python implementation of an AR process in A2. I generated synthetic data points with the following true parameters,
Using my implementation of an AR process, I fit a new AR process to these data and inferred the following parameter estimates:
As always, my derivations or code may have mistakes—please email me if you find any! —, but I believe the main idea here is correct.
Conclusion
Autoregressive processes are simple yet useful statistical models for random processes exhibiting autocorrelation. The parameters can be inferred in a variety of ways. Using the Yule–Walker equations is fairly straightforward both conceptually and in practice.
Appendix
A1. Inference via OLS
While fitting an AR model with OLS is fairly straightforward, it is not not causal and the estimator is not unbiased. To quote (Greene, 2003):
If the regression contains any lagged values of the dependent variable, then least squares will no longer be unbiased or consistent.
To see why, consider Equation again. Clearly, the response and the noise are correlated. This breaks the OLS assumption of strict exogeneity. Why? Because an implication of strict exogeneity is that each regressor is orthogonal to the error term for all observations:
Finally, strict exogeneity is required in the proof that the OLS estimator is unbiased. Taken together, if and are correlated, the OLS estimator is not unbiased.
A2. Autoregressive model in Python
import numpy as np
from   scipy.linalg import toeplitz
from   scipy.stats import norm


class AR:
    """Autoregressive model of order p.
    """

    def __init__(self, coefs=[1], obs_mean=0, obs_bias=0, noise_std=1):
        self.coefs      = coefs
        self.order      = len(self.coefs)
        self.obs_mean   = obs_mean
        self.obs_bias   = obs_bias
        self.noise_dist = norm(0, noise_std)

    def fit(self, xs):
        """Fit the AR model using the Yule–Walker equations.

        This is based off the statsmodels yule_walker function:

          https://www.statsmodels.org/stable/generated/
            statsmodels.regression.linear_model.yule_walker.html
        """
        # Demean data.
        xs = xs - xs.mean()
        n = xs.shape[0]
        r = np.zeros(self.order+1)
        # We can't put this inside the loop, since xs[:-0] is an empty slice.
        r[0] = (xs * xs).sum() / (n-1)
        for i in range(1, self.order+1):
            # r_i is the autocorrelation between all x_t and all x_{t-i}.
            r[i] = (xs[:-i] * xs[i:]).sum() / (n-i-1)
        R = toeplitz(r[:-1])
        beta = np.linalg.solve(R, r[1:])
        self.coefs = beta

    def sample(self, size=100):
        """Generate `size` random samples from the instantiated AR model.
        """
        c  = self.obs_bias
        x0 = self.obs_mean
        xs = np.array([x0] * self.order)

        if self.order > 1:
            pad = np.zeros(shape=(self.order-1))
            xs  = np.append(pad, xs)
        for t in range(size):
            e  = self.noise_dist.rvs()
            if self.order > 0:
                x = c + np.dot(xs[:self.order], self.coefs) + e
            else:
                # AR(0) is just white noise, possibly offset by c.
                x = c + e
            xs = np.append([x], xs)

        # I think of the most recent datum as the last element. We construct the
        # array in reverse to align with notation.
        return np.flip(xs)

    @property
    def stationary(self):
        """Return `True` if the AR model is weakly stationary, `False`
        otherwise.
        """
        return self.coefs.sum() < 1
- Greene, W. H. (2003). Econometric analysis. Pearson Education India.