How Dangerous Is Biking in New York?
I estimate my probability of serious injury or death from bike commuting to work in New York, using public data from city's Department of Transportation.
My conservative estimate is that if I bike to work in New York City most days over a twenty-year career, then I have a 2.4% chance of severe injury or death from my commute. This calculation is conservative in the sense that I think it’s an upper bound on my risk. It makes a lot of assumptions which may not hold in practice, but it is based on city-reported data, and I believe it is a reasonable first approximation.
Estimating the risk
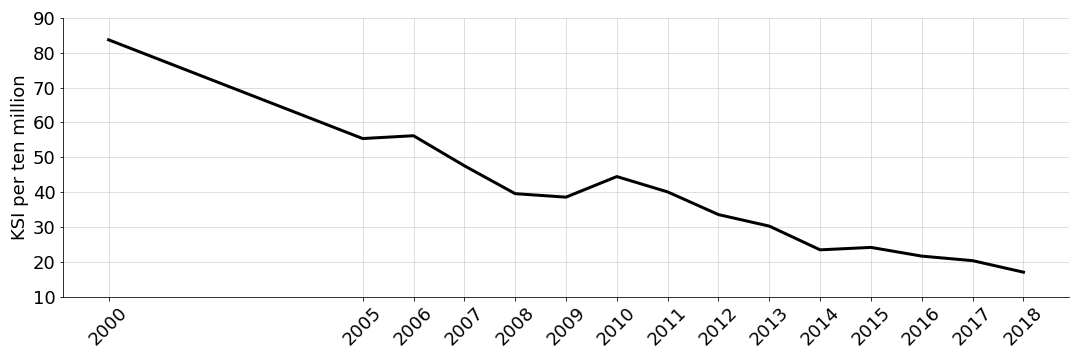
New York’s Department of Transportation (DOT) has good data about ridership and safety and vehicle collisions. Up until 2018, the city reported a metric for the number of people killed or severely injured (KSI) per 10 million rides. While the city appears to have stopped reporting the number—at least I cannot find more recent data for it—we have a clear trend over roughly two decades (Figure ). In 2000, the KSI per 10 million was over 80, while in 2018 it was less than 20. Based on these data, I think 30 KSI per 10 million rides is a reasonable conservative estimate of the risk per ride today. I am assuming this metric will not go back up to its historic levels but will also not continue going down.
Now let’s calculate my risk. Let be a random variable denoting my lifetime. Let’s assume that my only risk of death is via my commute and that dying occurs with probability , where is the estimated KSI over my lifetime of biking:
An assumption here is that my risk of a severe injury or death on each ride is independent of all other rides. Often, independence assumptions are obviously false simplifications, but here I think it is reasonable. Without a concerted effort on my part to learn to bike more safely, I suspect that each ride carries roughly the same risk. Then is a geometric random variable,
and the probability that I do not make rides without severe injury or death is given by the cumulative distribution function,
Now I simply have to estimate , how many times I’ll commute by biking. While in graduate school, I biked to my office most days, even in the winter. And at least currently, I love biking to work in NYC and have biked nearly every day, even through the winter. In my mind, a conservative estimate is biking to work four days a week for fifty weeks out of the year. I graduated last year, so let’s assume that I bike commute to work for twenty years. Thus, rides.
Now let’s plug in the numbers:
As I mentioned, this is conservative because and are both high in my mind. I doubt that I’ll bike to work this consistently over twenty years, and I also think (hope?) that NYC will become safer over time, that will actually decrease, as micro-transit options such as electric bikes, shared bikes, and scooters become more popular, driving biking infrastructure improvements.
Note that while I’ve framed the calculation in terms of number of years commuting, the units of 8000 is simply “rides”. Thus, this risk is independent of time. If I decided to do 8000 rides in a single year, then I’d have a 2.4% chance of dying of biking in that year, according to these assumptions.
A sanity check
As a sanity check, let’s find a value from the literature, and compare it to city’s data. I’d expect the probability of dying by cycling averaged over time and space to be less than the probability of dying by cycling in NYC.
According to (Keage & Loetscher, 2018), cycling twenty-eight miles has one micromort of risk. My commute is 4.3 miles one way, so roughly 3.2 commutes has one micromort of risk. So we can think of 8000 commutes as 2500 activities with one micromort of risk, giving us
To me, this suggests that my conservative estimate is a reasonable upper bound on my risk: it is roughly an order-of-magnitude greater than the estimated risk if we do not condition on location. This does not seem unreasonable if we assume biking in NYC is more dangerous than biking in other locations and that my conservative KSI per 10 million (30) is a bit high.
Takeaways
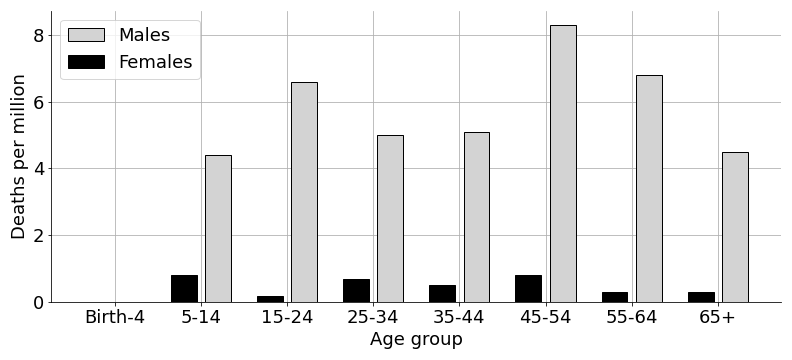
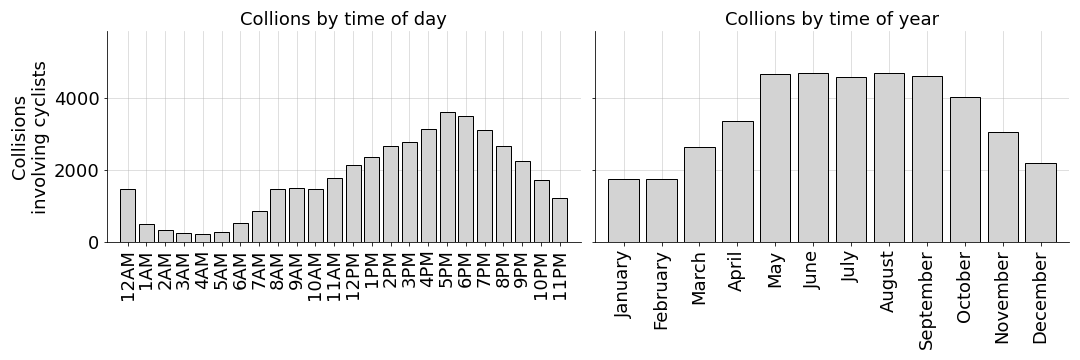
I tried analyzing cycling accidents, but it was difficult to draw meaningful conclusions. For example, men die more frequently than women while biking (Figure in A1) and more accidents occur during the summer months and around 5PM each day (Figure in A2). However, interpreting these data is tricky. For example, do more men die because more men bike or is it because they engage in riskier behavior? I had a different issue with analyzing accident locations: do more accidents happen at intersections because intersections are more dangerous or because they are easier locations to record? These kinds of questions are subtle and require careful data collection and analysis to answer. Furthermore, I found it hard to see how any conclusions would be actionable. I’m not going to start leaving work at 3PM, even if 5PM is a truly riskier time to bike.
| Year | Cars in collision | No cars in collision | ||
| Cyclists injured | Cyclists killed | Cyclists injured | Cyclists killed | |
| 2020 | 5175 | 24 | 55 | 1 |
| 2019 | 4611 | 27 | 57 | 1 |
| 2018 | 4304 | 10 | 55 | 0 |
| 2017 | 4397 | 24 | 88 | 0 |
| 2016 | 4592 | 18 | 64 | 0 |
| 2015 | 4433 | 14 | 28 | 1 |
So what can I do? In my mind, the simplest framing is that biking is dangerous because I am sharing the road with cars. To justify this claim, consider these data from DOT’s Bicycle Crash Data Reports1. They paint a clear picture about the risk of accidents with versus without cars. The simplest thing I can do is to plan my route to maximize time in bike lanes, ideally protected bike lanes. And I should be extra vigilant in moments where cars and I interact: when a car turns left into my path, when a car parked in a bike lane forces me into the road, when a large vehicle with poor visibility or a wide turn-radius such as a bus is next to me, and so forth.
Conclusion
Over the years, I’ve thought a lot about Mike Mullane’s talk on the normalization of deviance, or the process by which dangerous behavior is normalized because rules are routinely broken without consequence. In the talk, Mullane argues that the best teams of people working in high-risk environments (think firefighters or astronauts) do “little things consistently and religiously, day in and day out, until they become as natural as breathing.” Writing this blog post has been a good reminder not to normalize deviant behavior in my bike commuting. In my mind, the correct approach is to first recognize that the activity is truly dangerous and to then hedge that risk by habitualizing behaviors that maximize my safety.
Appendix
A1. Demographics
Note that these data are normalized by population, not number of rides, so they are not easily convertible to KSI per 10 million.
A2. Seasonality
-
For example, see the 2020 report here. You can simply change the year in the URL to find older reports. ↩
- Keage, H. A. D., & Loetscher, T. (2018). Estimating everyday risk: subjective judgments are related to objective risk, mapping of numerical magnitudes and previous experience. PLoS One, 13(12), e0207356.