Breusch–Pagan Test for Heteroscedasticity
I discuss the Breusch–Pagan test, a simple hypothesis test for heteroscedasticity in linear models. I also implement the test in Python and demonstrate that it can detect heteroscedasticity in a toy example.
At a high-level, various tests for heteroscedasticity in ordinary least squares (OLS) follow the same basic logic. The main idea is that the scedasticity of the OLS residuals will resemble the scedasticity of the true errors. This is because the OLS estimator is consistent ( converges in probability to ) regardless of scedasticity. Put differently, the proof that $\hat{\boldsymbol{\beta}}$ is consistent does not depend on the standard homoscedasticity assumption. Thus, any heteroscedasticity in the true error terms should be detectable in the residuals, which estimate the errors. These tests, then, are ultimately hypothesis tests applied to the OLS residuals (Greene, 2003).
The goal of this post is to understand a simple test for heteroscedasticity, the Breusch–Pagan test, which exemplifies this process. I’ll first discuss the main idea and then demonstrate the test on a toy problem.
Main idea
The basic idea of the Breusch–Pagan test is as follows. Suppose we run a linear regression,
where we assume that each is identically and normally distributed with mean zero and variance one. Now let’s express the variance of each datum as a function of some function , which does not depend on :
Here, is a -vector of coefficients which are independent of the coefficients . Why are we doing this? We’d like to test for heteroscedasticity. We can say that the null hypothesis is that the model has homoscedasticity, and this would require that
In other words, if we have homoscedasticity, than the conditional variance of each error term would not depend on or , i.e.
The null hypothesis (Equation ) implies that is a constant.
So performing the Breusch–Pagan test amounts to the following: fit the linear model in Equation ; estimate the error terms’ variances using the squared residuals; run a second regression to estimate in Equation ; and finally check if is “close enough” to .
In detail
To make “close enough” a precise claim, we should perform a hypothesis test. To do that, we need to prove that some statistic of the regression implied by Equation has a well-behaved distribution, such that we can compute -values. Proving this is the main result in (Breusch & Pagan, 1979).
To state Breusch and Pagan’s result, let denote the -th residual, the OLS estimate of . Now define the estimated residual variance as
This is just the residual sum of squares since has mean zero. Now define as
In words, is the proportion of the residual variance that is explained by the -th sample. Now fit a linear regression with the original data as the predictors and as the response:
Finally, compute the explained sum of squares from this second regression. Breusch and Pagan showed that, when the null hypothesis is true, one-half of this explained sum of squares is asymptotically distributed as with degrees of freedom.
Given that the response variables should be mean centered, the explained sum of squares is just
where . This means we can compute the desired quantity as
since . This is traditionally denoted “LM” because the Breusch–Pagan test is a Lagrange multiplier test or score test.
To summarize, we simply run both regressions, compute in Equation , and then test the null hypothesis,
We can then accept or reject the null hypothesis for our specific confidence level.
Example and implementation
In a previous post on OLS with heteroscedasticity, I gave a simple example of data on which OLS estimated incorrect -statistics.
from   numpy.random import RandomState
import statsmodels.api as sm

rng   = RandomState(seed=0)
x     = rng.randn(1000)
beta  = 0.01
noise = rng.randn(1000) + x*rng.randn(1000)
y     = beta * x + noise

ols = sm.OLS(y, x).fit()
print(f'{ols.params[0]:.4f}')   # beta  : -0.1634
print(f'{ols.tvalues[0]:.4f}')  # t-stat: -3.7863
Let’s revisited this example, and see if the Breusch–Pagan test can detect heteroscedasticity in advance. Here is a simple Python implementation of the test (for univariate data), fit using the OLS result and predictors in the example above:
from scipy.stats import chi2
def breusch_pagan(resid, x):
g = resid**2 / np.mean(resid**2)
ols = sm.OLS(g, sm.add_constant(x)).fit()
beta = ols.params[1]
g_hat = x * beta
lm = 0.5 * g.T @ g_hat
pval = chi2(1).pdf(lm)
return lm, pval
lm, pval = breusch_pagan(ols.resid, x)
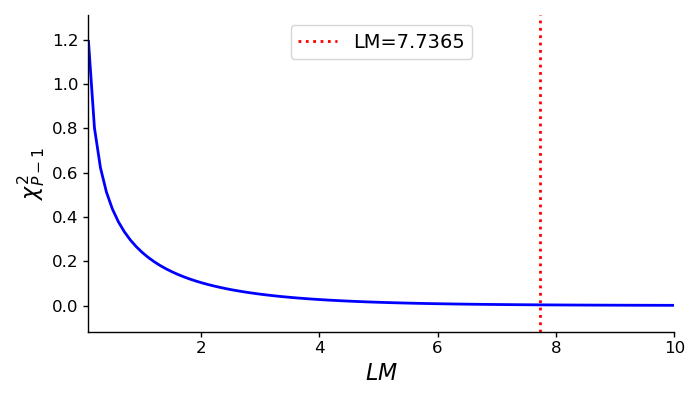
print(f'{lm:.4f}') # 7.7365
print(f'{pval:.4f}') # 0.0030
print(f'Reject null? {pval < 0.05}') # True
We can see that the Breusch–Pagan test rejects the null hypothesis of homoscedasticity using a confidence level (Figure ).
- Greene, W. H. (2003). Econometric analysis. Pearson Education India.
- Breusch, T. S., & Pagan, A. R. (1979). A simple test for heteroscedasticity and random coefficient variation. Econometrica: Journal of the Econometric Society, 1287–1294.