Consider the linear model
y=Xβ+ε,(1)
where y is an N-vector of response variables, X is an N×P matrix of P-dimensional predictors, β specifies a P-dimensional hyperplane, and ε is an N-vector of noise terms. The ordinary least squares (OLS) estimator of β is
β^=(X⊤X)−1X⊤y.(2)
In a post on the sampling distribution of the OLS estimator, I proved that β^ was unbiased, in addition to some other properties, such as its variance and its distribution under a normality assumption. However, this estimator is also consistent. The goal of this post is to understand what that means and then to prove that it is true.
Consistency in general
Let’s first discuss consistency in general. Let θ be a parameter of interest. Let θ^N be an estimator of θ. The subscript N makes it clear that θ^N is a random variable that is a function of the sample size N. The estimator θ^N is consistent if it converges in probability to θ. Formally, this means
N→∞limP(∣θ−θ^N∣≥ε)=0,for all ε>0.(3)
The way I think about this is as follows: pick any ε>0 that you would like; then I can find an N such that ∣θ−θ^N∣ is less than ε. In other words, this is a claim about how θ^N behaves as N increases. In particular, the claim is that θ^N is well-behaved in the sense that we can make it arbitrarily close to θ^ by increasing N.
This is different from unbiasedness. An unbiased estimator is one such that
E[θ^N]=θ.(4)
This is true for all N. So if I have thirty data points or three million, I know that the statistic θ^N, if unbiased, is unbiased in the sense that it will not be too high or too low from the true value on average. (This average is over many samples X of size N.) However, consistency is a property in which, as N increases, the value of the θ^N gets arbitrarily close to the true value θ.
One way to think about consistency is that it is a statement about the estimator’s variance as N increases. For instance, Chebyshev’s inequality states that for any random variable X with finite expected value μ and variance σ2>0, the following inequality holds for α>0:
P(∣X−μ∣>α)=α2σ2.(5)
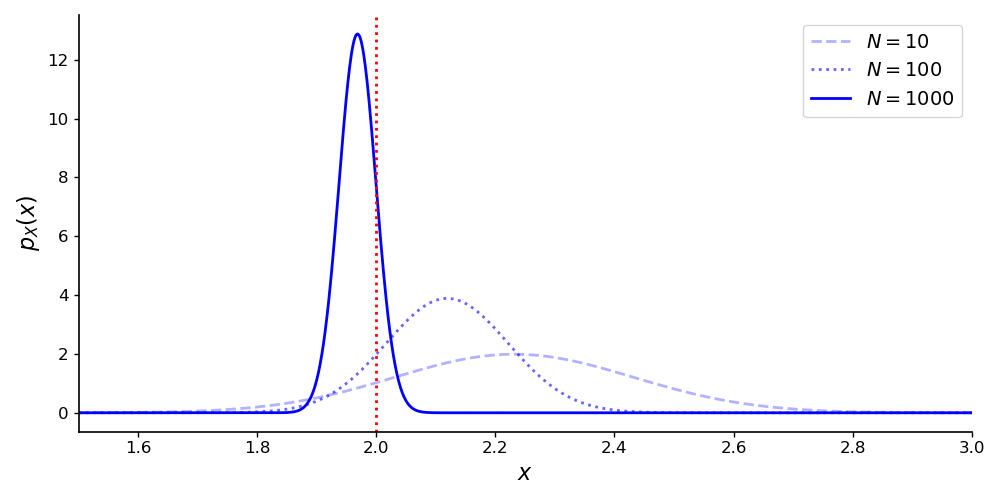
So if X is an unbiased estimator, then E[X]=μ. If we can show that σ2 goes to zero as N→∞ (X is a function of N here), then we can prove consistency. Of course, a biased estimator can be consistent, but I think this illustrates a scenario in which proving consistency is intuitive (Figure 1).
The notation in Equation 3 is a bit clunky, and it is often simplified as
plimθ^N=θ.(6)
Two useful properties of plim, which we will use below, are:
plim(a+b)plim(ab)=plim(a)+plim(b),=plim(a)plim(b),(7)
where a and b are scalars, vectors, or matrices. In particular, I find the second property surprising. Unfortunately, proving these properties would require a bigger dive into asymptotics than I am prepared to make right now. You can find a deeper discussion and proofs in textbooks on mathematical statistics, such as (Shao, 2003).
Consistency in OLS
We want to show that
plimβ^=β.(8)
First, let’s write down the definition of β^ and do some algebraic manipulation:
plimβ^=plim{(X⊤X)−1X⊤y}=plim{(X⊤X)−1X⊤(Xβ+ε)}=plim{(X⊤X)−1X⊤Xβ+(X⊤X)−1X⊤ε}=plimβ+plim{(X⊤X)−1X⊤ε}=β+plim(X⊤X)−1plimX⊤ε(9)
Here, we have done nothing more than apply Equations 1 and 2, do some matrix algebra, and use some basic properties of probability limits. At this point, you may notice that as N gets arbitrarily big, the sums in X⊤X will get arbitrarily large as well. However, we can simply multiply the rightmost term in the last line of Equation 9 by N/N to introduce normalizing terms:
plimβ^=β+plim(N1X⊤X)−1plimN1X⊤ε(10)
At this point, the standard assumption is that
plim(N1X⊤X)−1=Q(11)
for some positive definite matrix Q. In words, this just means that our data is “well-behaved” in the sense that the law of large numbers applies. To see this, recall that the weak law of large numbers (WLLN) is a statement about a probability limit. Let w be a random vector; then the WLLN states
plim[N1n=1∑Nwi]=E[w].(12)
The assumption in Equation 11 just says that the WLLN applies to each average in the covariance matrix. Because of the structure of X⊤X, Q must be positive definite. So if Q exists—and we assume it does—, clearly its inverse exists since it is positive definite. We can then write Equation 10 as
plimβ^=β+Q−1plimN1X⊤ε(13)
Thus, we only need to show that
plimN1X⊤ε=0,(14)
where 0 is a P-vector of zeros, and we’re done. We can write the matrix-vector multiplication in Equation 14 as a sum
X⊤ε=⎣⎢⎢⎡x11⋮xP1…⋱…x1N⋮xPN⎦⎥⎥⎤⎣⎢⎢⎡ε11⋮εN1⎦⎥⎥⎤=⎣⎢⎢⎡x11ε1+⋯+x1NεN⋮xP1ε1+⋯+xPNεN⎦⎥⎥⎤=n=1∑Nxnεn.(15)
Thus, we can write Equation 14 as an expectation,
plimN1X⊤ε=plimN1n=1∑Nxnεn=E[xnεn].(16)
So if we can show that this expectation is equal to 0, we can just invoke the WLLN, and we are done. To show this, we just apply the law of total expectation:
E[xε]=E[E[xε∣X]]=E[xE[ε∣X]]=⋆E[x0]=0.(17)
In step ⋆, we just use the strict exogeneity assumption of OLS.
To summarize, by the WLLN, Equation 16 is equal to an expectation, which we just showed was 0. Therefore, the right term in Equation 13 is zero, and we have
plimβ^=β(18)
as desired. Intuitively, I think this result makes sense. The OLS estimator is unbiased because we assume our observations are uncorrelated with the noise terms. Thus, as N increases, the WLLN simply kicks in, and the estimator converges in probability to the true value β.