Asymptotic Normality of Maximum Likelihood Estimators

Under certain regularity conditions, maximum likelihood estimators are "asymptotically efficient", meaning that they achieve the Cramér–Rao lower bound in the limit. I discuss this result.

Given a statistical model Pθ\mathbb{P}_{\theta} and a random variable XPθ0X \sim \mathbb{P}_{\theta_0} where θ0\theta_0 are the true generative parameters, maximum likelihood estimation (MLE) finds a point estimate θ^N\hat{\theta}_N such that the resulting distribution “most likely” generated the data. MLE is popular for a number of theoretical reasons, one such reason being that MLE is asymtoptically efficient: in the limit, a maximum likelihood estimator achieves minimum possible variance or the Cramér–Rao lower bound. Recall that point estimators, as functions of XX, are themselves random variables. Therefore, a low-variance estimator θ^N\hat{\theta}_N estimates the true parameter θ0\theta_0 more precisely.

To state our claim more formally, let X=X1,,XNX = \langle X_1, \dots, X_N \rangle be a finite sample where XPθ0X \sim \mathbb{P}_{\theta_0} with θ0Θ\theta_0 \in \Theta being the true but unknown parameter. Let p\rightarrow^p denote converges in probability and d\rightarrow^d denote converges in distribution. Our claim of asymptotic normality is the following:

Asymptotic normality: Assume θ^Npθ0\hat{\theta}_N \rightarrow^p \theta_0 with θ0Θ\theta_0 \in \Theta and that other regularity conditions hold. Then

N(θ^Nθ0)dN(0,I(θ0)1)(1) \sqrt{N}(\hat{\theta}_N - \theta_0) \rightarrow^d \mathcal{N}(0, \mathcal{I}(\theta_0)^{-1}) \tag{1}

where I(θ0)\mathcal{I}(\theta_0) is the Fisher information.

By “other regularity conditions”, I simply mean that I do not want to make a detailed accounting of every assumption for this post. Obviously, one should consult a standard textbook for a more rigorous treatment.

If asymptotic normality holds, then asymptotic efficiency falls out because it immediately implies

θ^NdN(θ0,IN(θ0)1).(2) \hat{\theta}_N \rightarrow^d \mathcal{N}(\theta_0, \mathcal{I}_N(\theta_0)^{-1}). \tag{2}

I use the notation IN(θ)\mathcal{I}_N(\theta) for the Fisher information for XX and I(θ)\mathcal{I}(\theta) for the Fisher information for a single XnXX_n \in X. Therefore, IN(θ)=NI(θ)\mathcal{I}_N(\theta) = N \mathcal{I}(\theta) provided the data are i.i.d. See my previous post on properties of the Fisher information for details.

The goal of this post is to discuss the asymptotic normality of maximum likelihood estimators. This post relies on understanding the Fisher information and the Cramér–Rao lower bound.

Proof of asymptotic normality

To prove asymptotic normality of MLEs, define the normalized log-likelihood function and its first and second derivatives with respect to θ\theta as

LN(θ)=1NlogfX(x;θ),LN(θ)=θ(1NlogfX(x;θ)),LN(θ)=2θ2(1NlogfX(x;θ)).(3) \begin{aligned} L_N(\theta) &= \frac{1}{N} \log f_X(x; \theta), \\\\ L^{\prime}_N(\theta) &= \frac{\partial}{\partial \theta} \left( \frac{1}{N} \log f_X(x; \theta) \right), \\\\ L^{\prime\prime}_N(\theta) &= \frac{\partial^2}{\partial \theta^2} \left( \frac{1}{N} \log f_X(x; \theta) \right). \end{aligned} \tag{3}

By definition, the MLE is a maximum of the log likelihood function and therefore,

θ^N=arg ⁣maxθΘlogfX(x;θ)    LN(θ^N)=0.(4) \hat{\theta}_N = \arg\!\max_{\theta \in \Theta} \log f_X(x; \theta) \quad \implies \quad L^{\prime}_N(\hat{\theta}_N) = 0. \tag{4}

Now let’s apply the mean value theorem,

Mean value theorem: Let ff be a continuous function on the closed interval [a,b][a, b] and differentiable on the open interval. Then there exists a point c(a,b)c \in (a, b) such that

f(c)=f(a)f(b)ab(5) f^{\prime}(c) = \frac{f(a) - f(b)}{a - b} \tag{5}

where f=LNf = L_N^{\prime}, a=θ^Na = \hat{\theta}_N and b=θ0b = \theta_0. Then for some point c=θ~(θ^N,θ0)c = \tilde{\theta} \in (\hat{\theta}_N, \theta_0), we have

LN(θ^N)=LN(θ0)+LN(θ~)(θ^Nθ0).(6) L_N^{\prime}(\hat{\theta}_N) = L_N^{\prime}(\theta_0) + L_N^{\prime\prime}(\tilde{\theta})(\hat{\theta}_N - \theta_0). \tag{6}

Above, we have just rearranged terms. (Note that other proofs might apply the more general Taylor’s theorem and show that the higher-order terms are bounded in probability.) Now by definition LN(θ^N)=0L^{\prime}_N(\hat{\theta}_N) = 0, and we can write

θ^Nθ0=LN(θ0)LN(θ~)    N(θ^Nθ0)=NLN(θ0)LN(θ~)(7) \hat{\theta}_N - \theta_0 = - \frac{L_N^{\prime}(\theta_0)}{L_N^{\prime\prime}(\tilde{\theta})} \quad \implies \quad \sqrt{N}(\hat{\theta}_N - \theta_0) = - \frac{\sqrt{N} L_N^{\prime}(\theta_0)}{L_N^{\prime\prime}(\tilde{\theta})} \tag{7}

Let’s tackle the numerator and denominator separately. The upshot is that we can show the numerator converges in distribution to a normal distribution using the Central Limit Theorem, and that the denominator converges in probability to a constant value using the Weak Law of Large Numbers. Then we can invoke Slutsky’s theorem.

For the numerator, by the linearity of differentiation and the log of products we have

NLN(θ0)=N(1N[θlogfX(X;θ0)])=N(1N[θlogn=1NfX(Xn;θ0)])=N(1Nn=1N[θlogfX(Xn;θ0)])=N(1Nn=1N[θlogfX(Xn;θ0)]E[θlogfX(X1;θ0)]).(8) \begin{aligned} \sqrt{N} L^{\prime}_N(\theta_0) &= \sqrt{N} \left( \frac{1}{N} \left[ \frac{\partial}{\partial \theta} \log f_X(X; \theta_0) \right] \right) \\ &= \sqrt{N} \left( \frac{1}{N} \left[ \frac{\partial}{\partial \theta} \log \prod_{n=1}^N f_X(X_n; \theta_0) \right] \right) \\ &= \sqrt{N} \left( \frac{1}{N} \sum_{n=1}^N \left[ \frac{\partial}{\partial \theta} \log f_X(X_n; \theta_0) \right] \right) \\ &= \sqrt{N} \left( \frac{1}{N} \sum_{n=1}^N \left[ \frac{\partial}{\partial \theta} \log f_X(X_n; \theta_0) \right] - \mathbb{E}\left[\frac{\partial}{\partial \theta} \log f_X(X_1; \theta_0)\right] \right) \tag{8}. \end{aligned}

In the last line, we use the fact that the expected value of the score function (derivative of log likelihood) is zero. Without loss of generality, we take X1X_1,

E[θlogfX(X1;θ0)]=0.(9) \mathbb{E}\left[\frac{\partial}{\partial \theta} \log f_X(X_1; \theta_0)\right] = 0. \tag{9}

See my previous post on properties of the Fisher information for a proof. Equation 88 allows us to invoke the Central Limit Theorem to say that

NLN(θ0)dN(0,V[θlogfX(X1;θ0)]).(10) \sqrt{N} L^{\prime}_N(\theta_0) \rightarrow^d \mathcal{N}\left(0, \mathbb{V}\left[\frac{\partial}{\partial \theta} \log f_X(X_1; \theta_0)\right]\right). \tag{10}

This variance is just the Fisher information for a single observation,

V[θlogfX(X1;θ0)]=E[(θlogfX(X1;θ0))2](E[θlogfX(X1;θ0)]=0)2=I(θ0).(11) \begin{aligned} \mathbb{V}\left[\frac{\partial}{\partial \theta} \log f_X(X_1; \theta_0)\right] &= \mathbb{E}\left[\left(\frac{\partial}{\partial \theta} \log f_X(X_1; \theta_0)\right)^2\right] - \left(\underbrace{\mathbb{E}\left[\frac{\partial}{\partial \theta} \log f_X(X_1; \theta_0)\right]}_{=\,0}\right)^2 \\ &= \mathcal{I}(\theta_0). \end{aligned} \tag{11}

For the denominator, we first invoke the Weak Law of Large Numbers (WLLN) for any θ\theta,

LN(θ)=1N(2θ2logfX(X;θ))=1N(2θ2logn=1NfX(Xn;θ))=1Nn=1N(2θ2logfX(Xn;θ))pE[2θ2logfX(X1;θ)].(12) \begin{aligned} L_N^{\prime\prime}(\theta) &= \frac{1}{N} \left( \frac{\partial^2}{\partial \theta^2} \log f_X(X; \theta) \right) \\ &= \frac{1}{N} \left( \frac{\partial^2}{\partial \theta^2} \log \prod_{n=1}^N f_X(X_n; \theta) \right) \\ &= \frac{1}{N} \sum_{n=1}^N \left( \frac{\partial^2}{\partial \theta^2} \log f_X(X_n; \theta) \right) \\ &\rightarrow^p \mathbb{E}\left[ \frac{\partial^2}{\partial \theta^2} \log f_X(X_1; \theta) \right]. \end{aligned} \tag{12}

In the last step, we invoke the WLLN without loss of generality on X1X_1. Now note that θ~(θ^N,θ0)\tilde{\theta} \in (\hat{\theta}_N, \theta_0) by construction, and we assume that θ^Npθ0\hat{\theta}_N \rightarrow^p \theta_0. Taken together, we have

LN(θ~)pE[2θ2logfX(X1;θ0)]=I(θ0).(13) L_N^{\prime\prime}(\tilde{\theta}) \rightarrow^p \mathbb{E}\left[ \frac{\partial^2}{\partial \theta^2} \log f_X(X_1; \theta_0) \right] = - \mathcal{I}(\theta_0). \tag{13}

If you’re unconvinced that the expected value of the derivative of the score is equal to the negative of the Fisher information, once again see my previous post on properties of the Fisher information for a proof.

To summarize, we have shown that

NLN(θ0)dN(0,I(θ0))(14) \sqrt{N} L^{\prime}_N(\theta_0) \rightarrow^d \mathcal{N}(0, \mathcal{I}(\theta_0)) \tag{14}

and

LN(θ~)pI(θ0).(15) L^{\prime\prime}_N(\tilde{\theta}) \rightarrow^p - \mathcal{I}(\theta_0). \tag{15}

We invoke Slutsky’s theorem, and we’re done:

N(θ^Nθ0)dN(1I(θ0)).(16) \sqrt{N}(\hat{\theta}_N - \theta_0) \rightarrow^d \mathcal{N}\left(\frac{1}{\mathcal{I}(\theta_0)} \right). \tag{16}

As discussed in the introduction, asymptotic normality immediately implies

θ^NdN(θ0,IN(θ0)1).(17) \hat{\theta}_N \rightarrow^d \mathcal{N}(\theta_0, \mathcal{I}_N(\theta_0)^{-1}). \tag{17}

As our finite sample size NN increases, the MLE becomes more concentrated or its variance becomes smaller and smaller. In the limit, MLE achieves the lowest possible variance, the Cramér–Rao lower bound.

Example with Bernoulli distribution

Let’s look at a complete example. Let X1,,XNX_1, \dots, X_N be i.i.d. samples from a Bernoulli distribution with true parameter pp. The log likelihood is

logfX(X;p)=n=1Nlog[pXn(1p)1Xn]=n=1N[Xnlogp+(1Xn)log(1p)].(18) \begin{aligned} \log f_X(X; p) &= \sum_{n=1}^N \log \left[p^{X_n} (1-p)^{1 - X_n} \right] \\ &= \sum_{n=1}^N \left[ X_n \log p + (1 - X_n) \log (1 - p) \right]. \end{aligned} \tag{18}

This works because XnX_n only has support {0,1}\{0, 1\}. If we compute the derivative of this log likelihood, set it equal to zero, and solve for pp, we’ll have p^N\hat{p}_N, the MLE. First, let’s compute the derivative:

plogfX(X;p)=n=1N[pXnlogp+p(1Xn)log(1p)]=n=1N[Xnp1Xn1p]=n=1N[Xnp+Xn11p].(19) \begin{aligned} \frac{\partial}{\partial p} \log f_X(X; p) &= \sum_{n=1}^N \left[ \frac{\partial}{\partial p} X_n \log p + \frac{\partial}{\partial p} (1 - X_n)\log (1 - p) \right] \\ &= \sum_{n=1}^N \left[ \frac{X_n}{p} - \frac{1 - X_n}{1 - p} \right] \\ &= \sum_{n=1}^N \left[ \frac{X_n}{p} + \frac{X_n - 1}{1 - p} \right]. \end{aligned} \tag{19}

The negative sign is due to the chain rule when computing the derivative of log(1p)\log(1-p). Now let’s set it equal to zero and solve for pp:

0=n=1N[Xnp+Xn1p]N1pN1p=n=1NXn[1p+11p]p(1p)1p=1Nn=1NXn.(20) \begin{aligned} 0 &= \sum_{n=1}^N \left[ \frac{X_n}{p} + \frac{X_n}{1 - p} \right] - \frac{N}{1 - p} \\ \frac{N}{1 - p} &= \sum_{n=1}^N X_n \left[ \frac{1}{p} + \frac{1}{1 - p} \right] \\ \frac{p(1 - p)}{1 - p} &= \frac{1}{N} \sum_{n=1}^N X_n. \end{aligned} \tag{20}

The terms (1p)(1 - p) cancel, leaving us with the MLE:

p^N=1Nn=1NXn.(21) \hat{p}_N = \frac{1}{N} \sum_{n=1}^N X_n. \tag{21}

In other words, the MLE of the Bernoulli bias is just the average of the observations, which makes sense. The second derivative is the derivative of Equation 1919 or

pn=1N[Xnp+Xn11p]=n=1N[Xnp2+Xn1(1p)2].(22) \frac{\partial}{\partial p} \sum_{n=1}^N \left[ \frac{X_n}{p} + \frac{X_n - 1}{1 - p} \right] = \sum_{n=1}^N \left[ - \frac{X_n}{p^2} + \frac{X_n - 1}{(1 - p)^2} \right]. \tag{22}

The Fisher information is the negative expected value of this second derivative or

IN(p)=E[n=1N[Xnp2+Xn1(1p)2]]=n=1N[E[Xn]p2E[Xn]1(1p)2]=n=1N[1p+11p]=Np(1p).(23) \begin{aligned} \mathcal{I}_N(p) &= -\mathbb{E}\left[ \sum_{n=1}^N \left[ - \frac{X_n}{p^2} + \frac{X_n - 1}{(1 - p)^2} \right] \right] \\ &= \sum_{n=1}^N \left[ \frac{\mathbb{E}[X_n]}{p^2} - \frac{\mathbb{E}[X_n] - 1}{(1 - p)^2} \right] \\ &= \sum_{n=1}^N \left[ \frac{1}{p} + \frac{1}{1 - p} \right] \\ &= \frac{N}{p(1-p)}. \end{aligned} \tag{23}

Thus, by the asymptotic normality of the MLE of the Bernoullli distribution—to be completely rigorous, we should show that the Bernoulli distribution meets the required regularity conditions—we know that
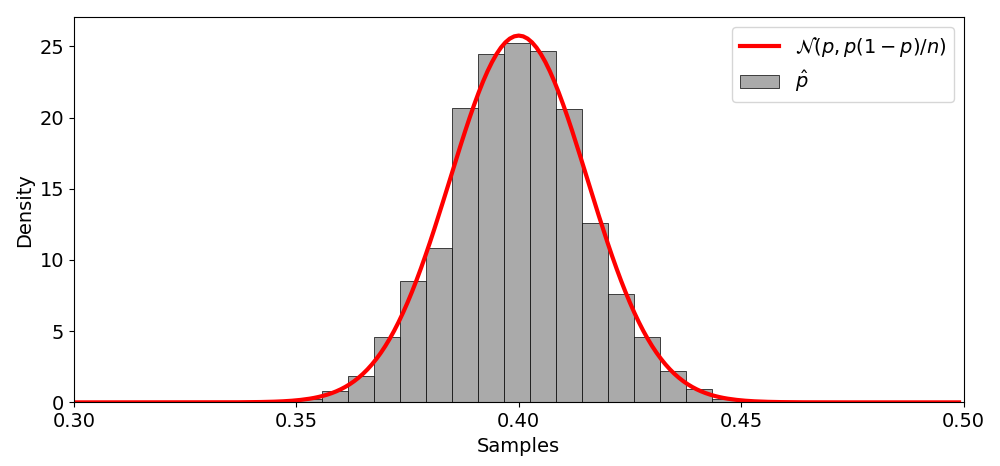
p^NdN(p,p(1p)N).(24) \hat{p}_N \rightarrow^d \mathcal{N}\left(p, \frac{p(1-p)}{N}\right). \tag{24}

We can empirically test this by drawing the probability density function of the above normal distribution, as well as a histogram of p^N\hat{p}_N for many iterations (Figure 11).

Figure 1. The probability density function of N(p,p(1p)/N)\mathcal{N}(p, p(1-p)/N) (red), as well as a histogram of p^N\hat{p}_N (gray) over many experimental iterations. The true value of pp is 0.40.4.

Here is the minimum code required to generate the above figure:

import numpy as np
from   scipy.stats import norm
import matplotlib.pyplot as plt


# Plot the asymptotically normal distribution.
N  = 1000
p0 = 0.4
xx = np.arange(0.3, 0.5, 0.001)
yy = norm.pdf(xx, p0, np.sqrt((p0 * (1-p0)) / N))

# Generate many random samples of size N and compute MLE.
mles = []
for _ in range(10000):
    X = np.random.binomial(1, p0, size=N)
    mles.append(X.mean())

# Plot histogram of MLEs.
plt.plot(xx, yy)
plt.hist(mles, bins=20, density=True)
plt.show()


Acknowledgements

I relied on a few different excellent resources to write this post: